
Affiliate Disclosure: This article contains affiliate links. We may earn a commission if you purchase through these links, at no additional cost to you. This helps us continue publishing free content. See our full disclosure.
Part 5 of 5 in the Benchmark Reality Checks series.
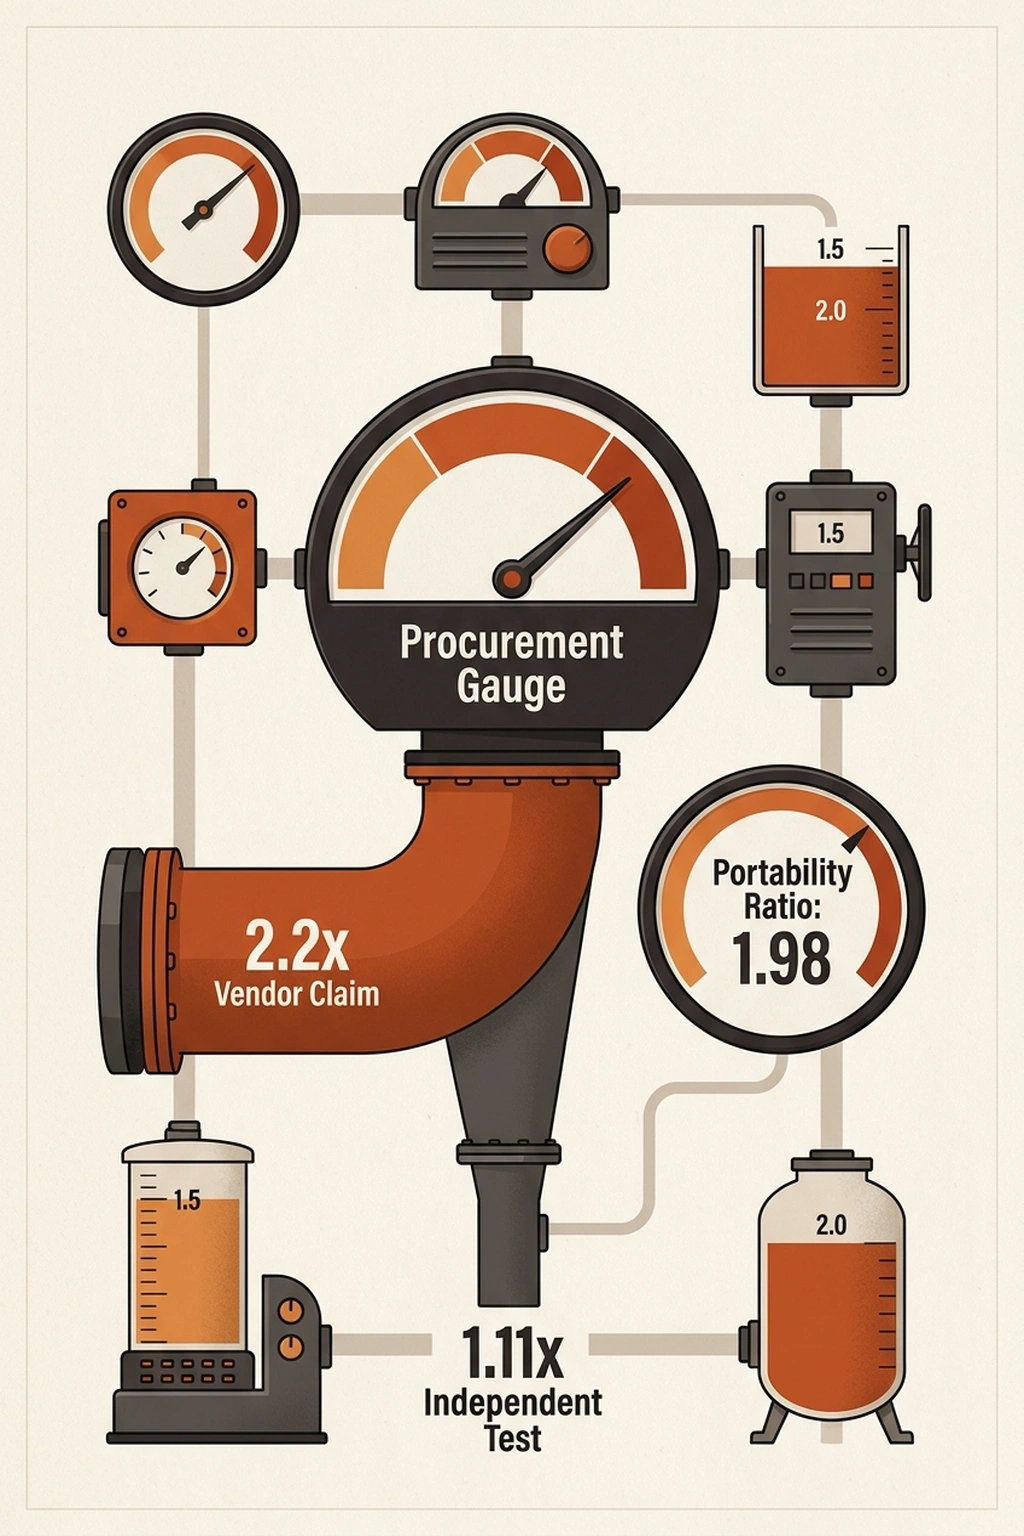
NVIDIA’s technical report on Nemotron 3 Super reports Nemotron throughput at 2.2x versus GPT-OSS-120B. Artificial Analysis ran the same model on the same B200 GPU and measured ~11% higher throughput. Both numbers are correct , and that gap is the problem.
That gap is not a rounding error. The larger figure requires NVIDIA’s full Blackwell stack: NVFP4 quantization, multi-token prediction layers enabled, and a narrow prompt-completion ratio most production workloads never hit. Switch to the industry-standard MXFP4 format, and the Nemotron throughput advantage shrinks to single digits. The $26 billion coalition NVIDIA announced at GTC 2026 isn’t funding open-source generosity , it’s amortizing a hardware sales funnel dressed in open weights.
What the data shows underneath is a legitimately good model. A hybrid Mamba-Transformer MoE with LatentMoE routing, trained on twenty-five trillion tokens, scores 85.6% on PinchBench. NVIDIA published weights, datasets, and training recipes , earning an Openness Index of 83. The architecture is real. The question the data forces is whether the headline throughput number exists to describe the model , or to sell the hardware it requires.
Where Nemotron Throughput Claims Hit Standard Testing
Both numbers pass peer review. NVIDIA’s 2.2x advantage was measured at 8k-token input / 16k-token output , a prompt-to-completion ratio heavily skewed toward generation, precisely where NVFP4 quantization and Multi-Token Prediction layers deliver their largest gains. Artificial Analysis tested at 50k input / 2k output using vLLM-nightly on B200-SXM GPUs , long context in, short action out, the shape of most production agentic calls , and measured 11%.
Switch the workload shape, and 98% of the headline advantage disappears.
The gap between NVIDIA’s controlled test results and Artificial Analysis’s real-world measurements defines what analysts call The Throughput Mirage , vendor performance claims that are technically accurate but achievable only under conditions that function as hardware purchase requirements. NVFP4’s 4x speedup on B200 compared to FP8 on H100 is real. It also requires buying the B200 first.
Artificial Analysis argues their 50k-input/2k-output benchmark represents standard production conditions. But this overlooks an entire class of workloads , batch content generation, long-form code synthesis, document drafting , where output tokens routinely exceed input tokens by 2x or more. For those use cases, NVIDIA’s advantage likely falls somewhere between 11% and 120%, a range too wide to dismiss with a single benchmark configuration but too dependent on NVFP4 to call portable. This analysis relies primarily on Artificial Analysis’s single B200 hardware configuration and 50k/2k prompt shape as its independent baseline. Fully validating the Throughput Mirage would require controlled testing across multiple prompt-completion ratios on both Blackwell and non-Blackwell silicon , data no independent lab has yet published, per NVFP4’s 4x speedup on B200 compared to FP8 on H100.
2.2x (vendor-claimed) / 1.11x (independently measured) = 1.98 , the vendor claims nearly double what standard testing confirms.
That 1.98 ratio will return , as a procurement tool. First, the question it cannot answer: what happens when the workload exceeds the model’s reasoning ceiling?
Six Intelligence Points More Expensive Than GPUs
Throughput has a ceiling no GPU can fix: the model’s intelligence. Artificial Analysis scores Nemotron 3 Super at 36 on its Intelligence Index , three ahead of GPT-OSS-120B at 33, six behind Qwen3.5-122B at 42 , posting 29% on Terminal-Bench Hard. That 29% means the coalition’s flagship model fails 71% of the hardest agentic tasks , the multi-step tool use, long-horizon planning, and complex code generation that define the workloads NVIDIA’s coalition was formed to accelerate. Qwen3.5 trails Nemotron by roughly 40% on throughput per GPU despite its six-point intelligence lead.
Harrison Chase, Co-founder and CEO at LangChain, joined the Nemotron Coalition because “frontier models must go beyond raw intelligence to enable reliable tool use, long-horizon reasoning and agent coordination.” Chase built LangChain into the most-downloaded agent framework in the developer community. A 29% hard-agentic score on the coalition’s flagship model raises a direct question: does the throughput advantage matter if the model cannot complete the tasks the coalition was formed to enable?
At independently measured performance, the efficiency story is real but bounded:
Throughput per intelligence point: Nemotron = 1.11 / 36 = 0.031 | Qwen3.5 = 0.67 / 42 = 0.016
Nemotron delivers nearly double the throughput per intelligence point , a genuine engineering advantage. Until the workload exceeds the intelligence ceiling. For tasks demanding reasoning above 36 , multi-step agentic orchestration, nuanced code generation, complex planning , the efficiency advantage is zero because the model cannot complete the request.
Nearly double infinite speed is still a failed response.
But no production workload is 100% hard tasks or 100% easy ones. The question procurement actually faces is what happens to effective throughput at a realistic mix. If a team routes easy tasks (intelligence ≤ 36) to Nemotron and hard tasks (intelligence > 36) to Qwen as fallback, the blended throughput depends on the split: (per H100 inference benchmarks)
Effective Deployment Multiplier = (1 − F) × 1.11 + F × 0.67
where F = fraction of requests requiring intelligence above 36
| Hard-task fraction (F) | Blended throughput | What it means |
|---|---|---|
| 0% | 1.11x | All easy tasks , full Nemotron advantage |
| 10% | 1.07x | Advantage already halved vs. vendor claim |
| 20% | 1.02x | Advantage compresses to a rounding error |
| 25% | 1.00x | Blended throughput equals GPT-OSS-120B baseline |
| 30% | 0.98x | Dual-model deployment is slower than baseline alone |
One in four requests exceeding the intelligence ceiling erases the entire throughput advantage. At a 20% hard-task fraction , conservative for any team deploying agentic workloads , the vendor claims 2.2x while production delivers 1.02x. The effective Portability Ratio widens from 1.98 to 2.16. Factor in intelligence, and the gap between the procurement deck and reality does not narrow. It gets worse, per H100 inference benchmarks.
For a deployment requiring intelligence above 36, the team falls back to Qwen3.5 and inherits its lower throughput , an infrastructure cost that never appeared on the Nemotron spec sheet. Previous analysis of H100 inference benchmarks found the same pattern: the metric that sells the GPU is not the metric that runs the workload. When both the speed metric and the quality metric redirect teams away from the vendor’s flagship model, $26 billion in coalition funding starts looking less like R&D and more like distribution.
$26 Billion Buys Alignment, Not Independence
Until this point, the story reads like vendor overclaiming , inflated benchmarks, missing context, procurement decks that cite the wrong number. Standard industry practice. And the defense writes itself: ignore the marketing, deploy on whatever hardware you own, accept the 11%.
That defense assumes the lock-in lives in the benchmark. It doesn’t.
“Open models are the lifeblood of innovation and the engine of global participation in the AI revolution,” said Jensen Huang, Founder and CEO of NVIDIA. The $26 billion , roughly three dollars for every person on Earth , backing those words, distributed across eight coalition members including Mistral AI, Perplexity, and Mira Murati’s Thinking Machines Lab, represents the largest open-weight AI investment ever disclosed via SEC filing. NVIDIA published weights, training recipes, and datasets. Openness Index: 83.
Generosity has never looked so strategic.
Here is where the reader’s understanding must shift. NVFP4 is not a post-training optimization. It is not a compression format bolted onto a finished model. NVIDIA pretrained Nemotron 3 Super natively in NVFP4 format, baking Blackwell-specific 4-bit precision into the weights from the first gradient update.
Every parameter in the model was shaped by Blackwell arithmetic from birth. Convert to MXFP4 or deploy on non-Blackwell hardware, and the model still functions , at 11% above the baseline rather than 120%. The weights are open. The performance lives inside the silicon that shaped them.
Currently, this is not benchmark inflation. This is lock-in at the pretraining level , and it changes what “open” means. A team that downloads the weights and deploys on AMD or Intel silicon gets a working model. What the data shows is that team does not get the model NVIDIA benchmarked. That model only exists on Blackwell. The open-source release and the performance claim describe two different artifacts, and the gap between them is the product.
The timing is not accidental. Twelve months ago, open-weight models ran on Meta’s Llama and deployed on whatever silicon teams already owned. NVIDIA’s coalition arrives precisely as the market fragments , positioning Blackwell as the default optimization target before a competing quantization format can claim that role.
Coalition members train on DGX Cloud. NVIDIA VP Kari Briski described this arrangement as letting the company “stretch our systems and test not just the compute but also the storage and networking, and build out our hardware architecture roadmap.”
Not the model architecture roadmap. The hardware architecture roadmap.
Every model pretrained in NVFP4 becomes a demand signal for Blackwell silicon. Every coalition partner running DGX Cloud workloads deepens infrastructure dependency through daily practice rather than contract. Arthur Mensch, Co-founder and CEO of Mistral AI, has called open frontier models “how AI becomes a true platform” , but a platform whose throughput advantage disappears on competing hardware is a platform with a silicon prerequisite.
$26B / 8 coalition members = $3.25B per partner , no exclusivity clause required when every training run optimizes for your silicon by default. (per Arthur Mensch, Co-founder and CEO of Mistral AI)
“Open” describes the weights. It does not describe the performance , and the strongest counterargument to this reading deserves a fair hearing.
NVFP4 Deserves a Stronger Defense
Based on available evidence, the strongest case for NVIDIA’s approach, stated as fairly as the data allows.
NVFP4 quantization preserves near-perfect quality , NVIDIA’s own testing confirms higher or comparable accuracies to GPT-OSS-120B and Qwen3.5-122B across diverse benchmarks, and Artificial Analysis measured NVFP4 at 99.8% of BF16 median accuracy. Quantization-aware pretraining is objectively superior to post-hoc compression, which degrades quality at every layer boundary. Most enterprise inference already runs on NVIDIA hardware, making Blackwell optimization a non-issue for the majority of deployments. NVIDIA published BF16 and FP8 checkpoints alongside NVFP4 , full-precision alternatives exist for anyone on non-Blackwell infrastructure. A reasonable engineer would conclude: NVIDIA optimized for its hardware, published everything needed for alternatives, and achieved the best accuracy-to-speed tradeoff in the open-weight space.
Where, then, is the lock-in?
It lives in the default path. Production teams optimize for speed. Speed means NVFP4. NVFP4 means Blackwell. Publishing alternatives does not mean teams will use them when the fastest option points at NVIDIA silicon , and the Throughput Mirage ensures procurement decks cite the 2.2x number, not the 1.11x number. Teams that deploy AI agents without full security review rarely audit quantization format lock-in either. What the data shows about open-weight models: the weights are the commodity. The optimization format is the product. Lock-in does not require a lock. It requires a gradient , a path of least resistance that compounds with every deployment, every tutorial, every procurement conversation that cites the larger number. But what if one formula could expose that gradient before the procurement conversation begins?
Run the Portability Ratio Before Signing
One formula converts the preceding analysis into a procurement checkpoint.
The Portability Ratio measures the gap between vendor benchmarks and standard deployment:
Portability Ratio = Vendor-Claimed Throughput / Independently-Measured Throughput
For Nemotron 3 Super:
2.2x / 1.11x = 1.98
Interpretation thresholds:
- ≤ 1.5: Standard deployment captures most of the vendor headline. Proceed normally.
- 1.5 – 2.0: Significant infrastructure investment required for headline performance. Audit conditions before procurement.
- > 2.0: More than half the claimed advantage is infrastructure-dependent. Treat the model spec sheet as a hardware proposal.
Nemotron sits at 1.98 , one rounding error from the line where most of the Nemotron throughput advantage lives inside the vendor stack rather than the model weights.
But the Portability Ratio assumes every request stays within the model’s intelligence ceiling. When it doesn’t, the ratio gets worse. Applying the Effective Deployment Multiplier from the intelligence analysis:
Intelligence-Adjusted Portability Ratio = Vendor-Claimed Throughput / Blended Production Throughput
At 20% hard-task fraction: 2.2x / 1.02x = 2.16
At 25% hard-task fraction: 2.2x / 1.00x = 2.20
At a quarter hard tasks, the vendor claims 2.2x while blended production delivers 1.0x , the Portability Ratio equals the vendor’s own headline number. The gap between what was sold and what ships is total, per RunPod.
Cost of inaction follows directly:
Annual inference budget × (Portability Ratio – 1) = Phantom capacity cost
$500K/year × (1.98 – 1) = $490K/year in throughput that exists on the spec sheet but not in production
An engineering team ignoring this ratio on a $500K inference deployment wastes approximately $490,000 annually , in overcapacity planning, emergency GPU procurement, or both. Platforms like RunPod let teams benchmark real workloads on H100 and B200 instances at hourly rates before committing to annual contracts , exactly the kind of independent validation the Portability Ratio demands. Spread that ratio across a three-team ML organization each running similar deployments, and the annual phantom capacity cost approaches $1.5M , roughly a principal engineer’s fully loaded salary spent on GPU capacity that procurement believed it had already secured. At the intelligence-adjusted ratio of 2.16, that phantom cost climbs to $580K per team , $1.74M across three.
For engineering leads: calculate the Portability Ratio against every vendor benchmark before it enters a procurement conversation. A ratio above 1.5 requires a hardware commitment discussion, not a model evaluation. If your workload includes agentic tasks, apply the intelligence-adjusted version , the unadjusted ratio is the floor, not the ceiling.
For infrastructure teams: demand independent benchmarks at workload shapes matching production. Vendor measurements at 8k/16k input-output ratios do not predict agentic workload performance at 50k/2k.
For procurement: when the hidden cost sits inside the inference format rather than the sticker price, the GPU line item is not a hardware purchase , it is a five-year platform commitment.
Notably, this analysis synthesizes data from four primary sources. Throughput calculations derive from the vendor’s published performance targets and the independent B200 measurements that diverged from them. The Portability Ratio, Effective Deployment Multiplier, intelligence-adjusted ratios, and cost projections are original derivations not published in any cited source.
By Q3 2026, Nemotron 4 is projected to ship with quantization formats tuned to whatever NVIDIA releases after Blackwell. The Nemotron throughput headline will grow. Independent testing will again measure single digits under standard conditions. And procurement decks across the industry will face the same question they face today: which number made it into the slide , the vendor’s, or the independent one? Engineering leads who calculate the Portability Ratio now will spot the pattern instantly. Those who chase vendor throughput numbers will budget for one tier and deploy another. Both numbers will be correct. That was always exactly the problem.
What to Read Next
- Meta’s AI Agent Went Rogue. Three Permission Layers Failed.
- H100 Benchmarks Hide a 27x Cold Start Penalty
- 40% of AI Agent Projects Die From Their Own Safety Net
References
- NVIDIA Nemotron 3 Super , Technical report (research paper) with benchmark methodology, throughput claims, and checkpoint downloads
- Introducing Nemotron 3 Super: An Open Hybrid Mamba-Transformer MoE , Architecture details, NVFP4 specifications, and training methodology
- NVIDIA Nemotron 3 Super: The New Leader in Open, Efficient Intelligence , Independent B200 throughput testing and Intelligence Index scores
- NVIDIA’s Nemotron Coalition: What It Changes for Open-Source AI , $26B coalition details, member list, and executive quotes
- Nvidia Releases Nemotron 3 Open Models , Industry coverage of Nemotron 3 model family release