
Affiliate Disclosure: This article contains affiliate links. We may earn a commission if you purchase through these links, at no additional cost to you. This helps us continue publishing free content. See our full disclosure.
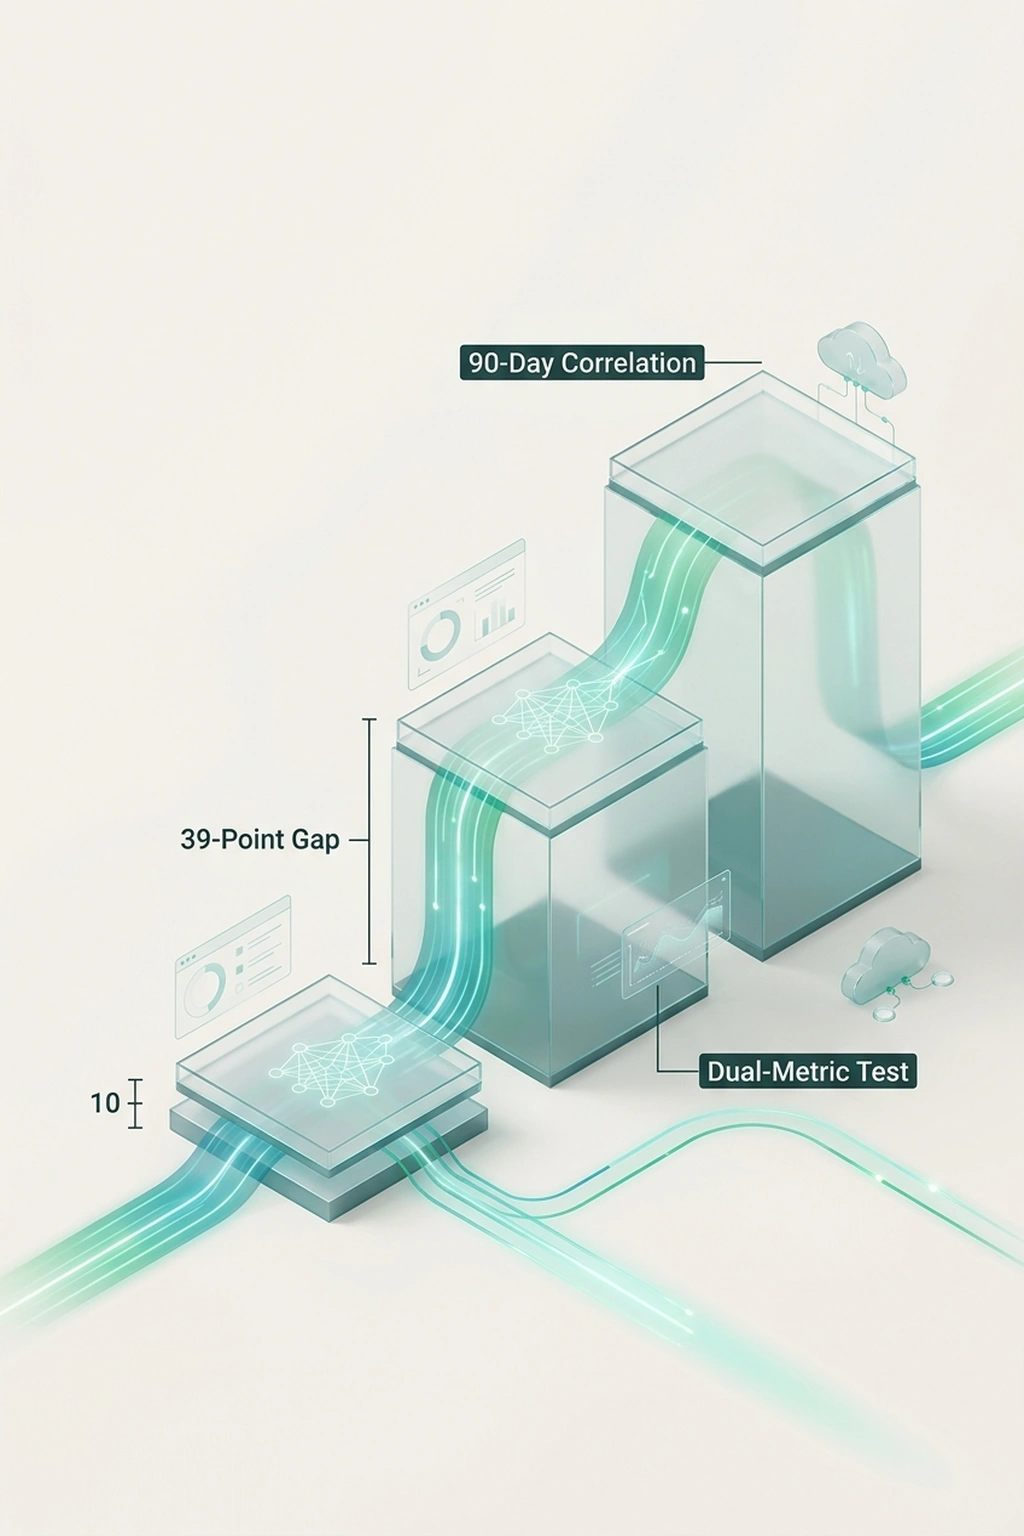
Thirty-nine percentage points. That is the gap between what developers believe AI coding tools do for their productivity and what a controlled experiment measured — a gap that any AI tool mandate must reckon with before tying usage to performance reviews. In a randomized trial by METR, experienced open-source developers working on their own repositories completed tasks slower with AI than without. Even after the experiment, those developers still believed they had sped up.
JPMorgan Chase picked this moment to build an AI tool mandate around that uncorrectable blind spot. Internal documents obtained by Business Insider show the bank now expects the majority of its 65,000-person Global Technology division — more engineers than fill Yankee Stadium — to “drive excellence” by adopting AI. A dashboard labels engineers as “light,” “heavy,” or “non” users, and that data feeds into performance assessments. “There’s a lot of anxiety in the environment right now,” one longtime IT developer in the group told Business Insider.
That anxiety is well-placed — the bank is grading engineers on how much they use a tool whose users cannot accurately tell whether it helps. What follows traces that structural flaw to its source and proposes the one diagnostic that catches it before review cycles cement the damage.
What the Dashboard Measures
JPMorgan’s performance framework grades every technologist on two axes: “what you achieve” and “how you achieve it” (Tekedia). AI adoption falls explicitly under “how” — embedding the assumption that using the tool improves the method. If METR’s data holds at scale, the assumption inverts: the framework rewards the behavior most likely to slow engineers down.
The bank’s 2026 technology budget hit $19.8 billion, with $1.2 billion earmarked for AI across over 400 production use cases — consistent with the bank’s official annual report disclosure of sustained multi-year technology investment growth. Tracking who touches $1.2 billion in tooling looks like textbook operational oversight — until the tooling’s own output data enters the frame.
Faros AI studied 10,000 developers across 1,255 teams and found that high-AI-adoption teams produce 154% larger pull requests, 91% longer review cycles, and 9% more bugs per developer — while merging 98% more PRs. On JPMorgan’s dashboard, a “heavy” user shipping bloated, buggier code at twice the volume registers identically to a top performer.
Those numbers compound in a way the dashboard cannot represent. An engineer who merges 98% more pull requests, each carrying 9% more defects, generates 2.16 times the total bug output of a non-user (1.98 × 1.09). Each of those PRs then sits in a review queue 91% longer, consuming reviewer hours that appear nowhere in the adoption metric. At JPMorgan’s scale, if one-third of 65,000 engineers reach heavy-user status, the division absorbs roughly 21,667 engineers’ worth of doubled defect volume flowing through review pipelines that take nearly twice as long to clear — while the dashboard reports exactly the adoption curve management ordered, per 10,000 developers across 1,255 teams.
1.98 × 1.09 = 2.16x bug output per heavy user. Invisible at the dashboard level. Compounding at the codebase level.
Thirty-nine points of perceptual distortion, channeled through a dashboard that cannot distinguish volume from value.
The Perception Gap Trap
What METR’s controlled experiment and Faros’s production telemetry reveal, when read side by side, is what this analysis calls The Perception Gap Trap — a feedback loop where mandated usage metrics systematically reward the behavior most likely to obscure productivity loss. Engineers generating the most AI-assisted code are statistically the least able to detect when it costs them time.
METR’s participants averaged five years and 1,500 commits in the repositories they maintained — experts on familiar ground. According to the researchers, participants accepted less than 44% of AI-generated suggestions, with many requiring cleanup, debugging, or replacement. Despite this, their post-study self-assessment still registered a 20% perceived speedup against a 19% measured slowdown.
“LLMs are a tool, and we need to start learning its pitfalls and have some self-awareness,” said Quentin Anthony, a developer in the METR trial (DX Newsletter). Anthony could name the gap between what the tool felt like and what the clock showed. Most of his peers could not — which is the exact flaw a usage-based performance review exploits.
Scale the distortion to career incentives. An engineer labeled “heavy” who believes the tool accelerates delivery has zero motivation to question the classification — it boosts their review. An engineer labeled “light” who correctly perceives no gain faces a career penalty for being right.
Adverse selection, running on autopilot.
Here is where the standard defense breaks. A year ago, the consensus developer position held that usage mandates would self-correct: heavy users would outperform light users on measurable outcomes, the correlation would vindicate the policy, and the mandate would become indistinguishable from good management. The logic seemed clean. Adoption creates familiarity; familiarity creates skill; skill creates measurable output gains. In that model, JPMorgan’s dashboard is not surveillance — it is patient capital, waiting for the learning curve to pay off. Readers may recognize this and nodding — if that sequence feels obviously true — hold the assumption for one more paragraph.
Google’s 2024 DORA report killed it. Across 39,000 professionals in every major industry — the largest annual survey of software delivery performance in existence — as AI adoption increased, delivery throughput dropped an estimated 1.5% and delivery stability fell an estimated 7.2%. This used a completely independent methodology, a completely different population, and produced the same directional result: more AI adoption, worse outcomes. Faros’s production dataset of 10,000 engineers confirmed independently that the pattern holds at organizational scale: the researchers “[observed] no significant correlation between AI adoption and improvements at the company level.”
Three studies. Sixteen developers in a controlled trial. Thirty-nine thousand professionals in an industry survey. Ten thousand engineers in production telemetry. All converging on one conclusion: AI tool usage is not a reliable proxy for engineering productivity. JPMorgan’s dashboard treats it as exactly that.
To disprove this convergence, a single result would suffice: a controlled trial showing experienced developers measurably faster with AI on familiar codebases — not self-reported faster, measured faster. No published study has produced that result. The absence of counter-evidence across three independent methodologies spanning 16 to 39,000 subjects is not a gap in the literature. It is the literature.
According to industry data, no source published this calculation. JPMorgan’s $19.8 billion technology budget across 65,000 technologists works out to approximately $305,000 per head — salary, tooling, and infrastructure combined. Apply METR’s 19% time penalty to the engineering-labor share (conservatively half that figure) and each “heavy” user absorbs roughly $29,000 in annual productivity drag. If the mandate converts one-third of the division to heavy status: 21,667 × $29,000 ≈ $629 million per year — invisible to every usage dashboard JPMorgan currently runs.
$19.8B ÷ 65,000 = ~$305K/head. $305K × 0.50 × 0.19 = ~$29K per heavy user. 21,667 × $29K ≈ $629M, per 400+ AI use cases in production.
Whether the bank’s actual figure is $629 million or half that depends on how METR’s effect — measured across 16 developers on open-source tasks — scales to proprietary banking codebases. No public dataset resolves that question. But the direction is consistent across all three independent studies, and JPMorgan’s current instrumentation cannot detect it in either direction. The obvious counter: perhaps not mandating AI costs more — but that defense assumes the mandate is producing value it has never independently measured, per 400+ AI use cases in production.
The Case for an AI Tool Mandate
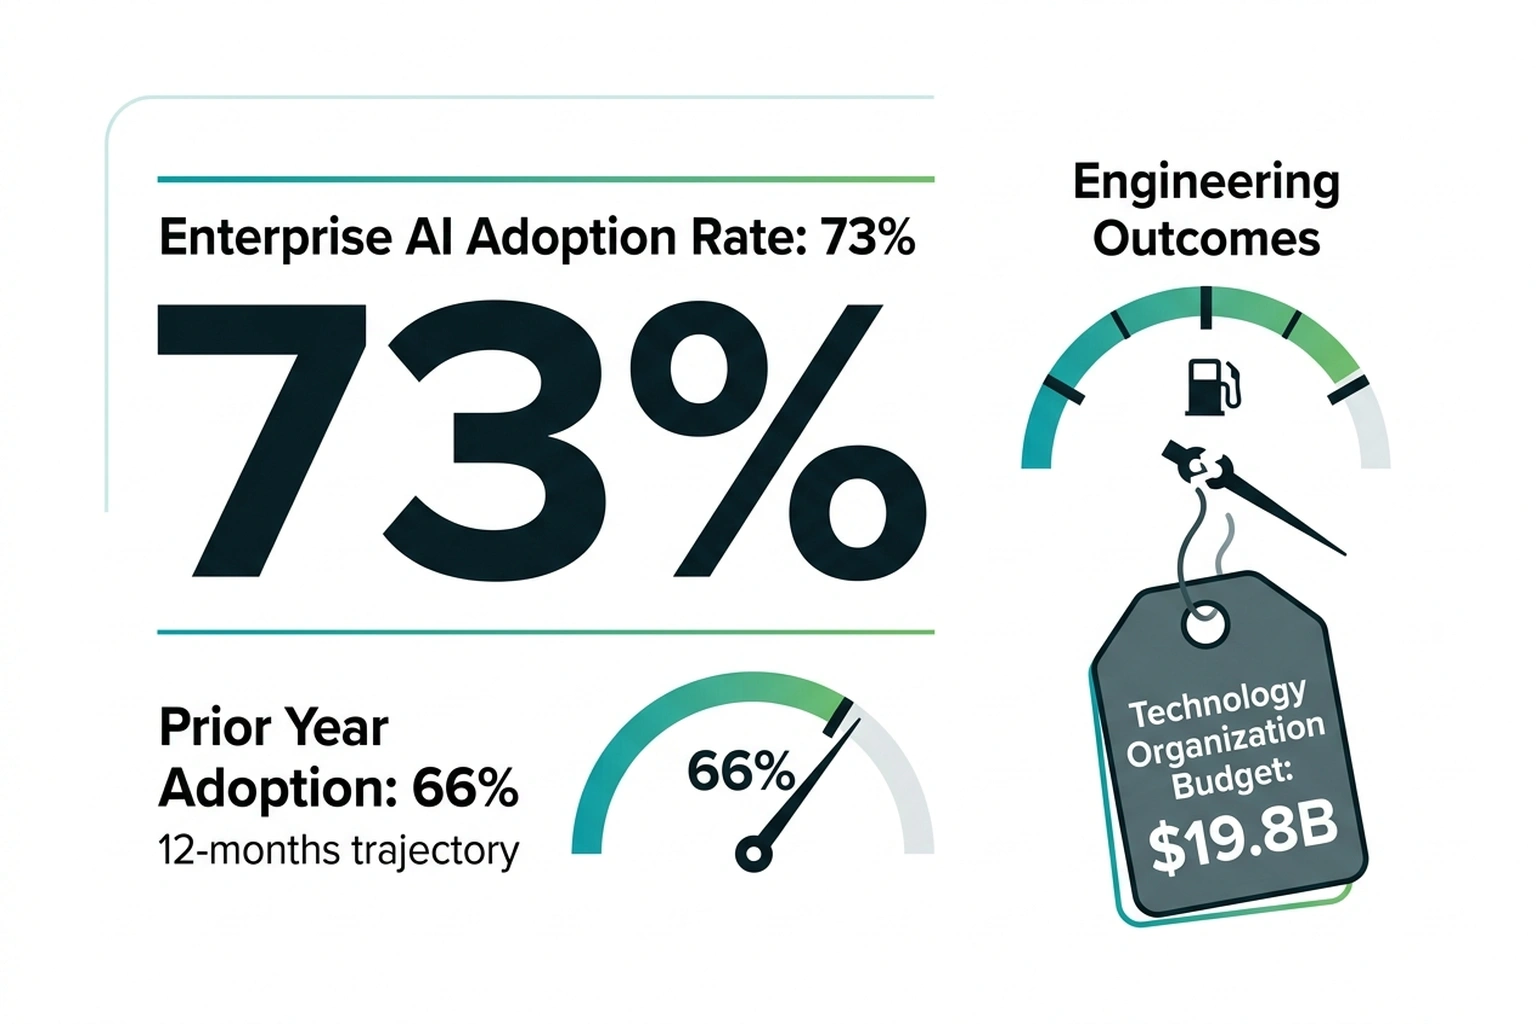
Steelman the mandate. JPMorgan has 400+ AI use cases in production and has tripled its AI investment in two years. Bain’s 2025 enterprise survey found 73% of companies now use AI in software development, up from 66% a year prior; organizations that delayed fell behind on tooling, recruitment, and vendor partnerships. As Wall Street firms cut headcount during record revenue, the competitive pressure to automate is not hypothetical. A forcing function prevents the worst outcome for a $19.8 billion technology organization: paying for tools nobody touches.
But Bain’s survey measures adoption breadth, not adoption outcomes — and that distinction is load-bearing. Seventy-three percent of companies using AI in development tells you nothing about whether those companies ship better software. Neither METR’s controlled trial nor Google’s DORA report found that higher adoption correlated with better engineering performance. Treating “more companies are doing it” as evidence that doing it works is the same input-over-outcome reasoning JPMorgan’s dashboard encodes.
“The gains from AI code assistants are structurally limited by how much of the job is actually coding,” wrote Abi Noda, CEO of DX, which measures developer experience across enterprise engineering teams (DX). Noda — whose company sells the productivity measurement tools enterprises use to justify these budgets — captures the real tension: if JPMorgan’s engineering practices are already strong, mandated AI exposure could genuinely accelerate them. Workflow tools like Raycast that consolidate AI interactions into a single launcher address Noda’s point directly — the productivity ceiling lifts when AI augments the non-coding 70%, not just the coding 30%. The argument that tracked adoption beats zero adoption is defensible.
But forcing functions only work when someone measures what the function produces, not merely whether it ran. JPMorgan’s framework tracks inputs without validating outputs — tool opens, not code quality; Copilot sessions, not defect rates. That gap turns a forcing function into a compliance checkbox with career stakes.
Any engineering leader already tracking shadow AI costs at 3:1 ratios knows the pattern: when adoption metrics substitute for outcome measurement, the metric gets gamed and the outcomes get worse. That feedback-loop failure predicts this mode with uncomfortable specificity. What the mandate needs is not removal — it is a diagnostic that catches the gap before Q4 reviews lock in the first round of results. The question is whether such a test can be built from data the bank already collects.
The Dual-Metric Test
On closer inspection, the Dual-Metric Test exists because thirty-nine percentage points of perceptual error do not self-correct. This analysis proposes it as a 90-day correlation of individual AI tool usage against two outcome variables — bug density per pull request and mean review cycle time — run before any performance review that weights AI adoption.
Execute it as follows. Pull each engineer’s weekly Copilot usage score from the adoption dashboard. Pull their weekly bug density (defects flagged during review or post-merge) and mean PR review turnaround from the CI/CD pipeline. Compute the Pearson correlation between usage and each metric over the 90-day window. If r ≤ 0 for either variable — usage climbs while quality stagnates or drops — the forced adoption policy is measuring compliance, not productivity. Adjust the policy before the review cycle closes.
Now quantify the review mechanism. If code review consumes roughly 20% of an engineer’s time and review cycles double on high-adoption teams — the trajectory Faros documented — that share approaches 40%. At JPMorgan’s $305,000 per-head allocation, the additional 20 percentage points of review burden cost approximately $30,000 per reviewer annually.
$305K × 0.50 × 0.20 = ~$30K per reviewer per year, per METR-documented.
That overhead appears nowhere in any AI productivity dashboard.
Cost of inaction for a 50-engineer team where one-third become heavy AI users: 17 engineers absorbing $29,000 each in METR-documented slowdown ($493,000), plus review overhead cascading across the team at roughly $30,000 per reviewer exposed to doubled review cycles. Conservative estimate: $1 million per year for a single team running a forced AI adoption policy without outcome correlation. Ninety days of the Dual-Metric Test costs nothing but a database query.
The security implication is the one most likely to be missed. If AI-heavy PRs double review volume — the trajectory Faros documented — security-critical reviews face the same time pressure as routine ones. For CISOs: audit whether AI-heavy PRs are escaping security review under volume pressure. For engineering managers: run the Dual-Metric Test before Q4 reviews. For CFOs: demand usage-to-defect correlation data before approving next year’s $1.2 billion AI line item, per METR-documented.
From a practical standpoint, the longtime JPMorgan developer who described “anxiety in the environment” may already sense what the metrics will eventually confirm. Prediction: for engineers with more than three years of experience in their current codebase, the correlation between “heavy” AI usage labels and code quality will be flat or negative by Q4 2026.
This analysis relies primarily on METR’s 16-participant randomized trial as its controlled effect-size baseline, then extrapolates that effect to a 65,000-person organization operating on proprietary banking codebases. Independent validation would require JPMorgan — or a comparably sized institution — to run its own randomized controlled trial with internal engineers on production repositories, a study design no bank has publicly disclosed.
Companies drafting similar policies: run the Dual-Metric Test before the first review cycle. Ninety days of data costs nothing. A year of adverse selection costs careers — and by Q4, the correlation will be visible in the data whether anyone chooses to look or not.
What Engineering Leaders Should Do Before the Next Review Cycle
-
Run the 90-day correlation now. Execute the Dual-Metric Test described above — correlate weekly Copilot usage against bug density and PR review turnaround. If r ≤ 0 for either, your adoption policy is measuring compliance, not productivity.
-
Separate adoption tracking from performance reviews. Usage data belongs in tooling dashboards, not HR systems — at minimum until the correlation above proves consistently positive across teams.
-
Audit perceived versus measured productivity. Ask a random sample of engineers to estimate their AI-assisted speedup, then compare against task-completion telemetry. If the gap exceeds 10 percentage points, self-reported data is unreliable for policy decisions. METR’s 39-point gap is the benchmark to beat.
-
Benchmark unassisted baselines. Before grading engineers on AI usage, measure what top performers deliver without it. Without that baseline, no dashboard can distinguish a productivity gain from a volume increase.
-
Publish the correlation internally. If the Dual-Metric Test shows positive results, share them — adoption backed by evidence will outperform adoption backed by mandate. If it shows negative results, the engineering organization needs to know before review season, not after.
What to Read Next
- AI Coding Tools Cost $6,750/yr in Hidden Rework — 5 Ranked by True Price
- Shadow AI Costs $21K Per App: The 3:1 Ratio Nobody Tracks
- AI Accounting Tools Cite Tax Rules They Invented
References
- METR: Measuring the Impact of Early-2025 AI on Experienced Open-Source Developer Productivity — Randomized controlled trial of 16 experienced developers across 246 tasks.
- METR: Changing Our Developer Productivity Experiment Design — Updated methodology and study design notes.
- Business Insider: JPMorgan Objectives for Software Engineers — Internal documents on AI adoption mandates and performance framework.
- Google DORA: 2024 Accelerate State of DevOps Report — AI adoption impact data from 39,000 professionals.
- Faros AI: The AI Productivity Paradox — Production telemetry from 10,000 developers across 1,255 teams.
- Prism News: JPMorgan Boosts 2026 Tech Budget — $19.8 billion technology budget breakdown.
- Bain & Company: AI Moves from Pilots to Production — Enterprise AI adoption rates across industries.
- DX Newsletter: Why Aren’t AI Productivity Gains Higher? — Abi Noda’s framework for measuring AI impact.
- Tekedia: JPMorgan Raises the Bar for Engineers, Ties Performance to AI Adoption — Performance framework and “how you achieve it” criteria.
- Artificial Intelligence News: JPMorgan Expands AI Investment — 400+ production AI use cases.
- DX Newsletter: METR Study on How AI Affects Developer Productivity — Quentin Anthony interview on perception gap.
- Decoded AI Tech: Shadow AI Costs $21K Per App — The 3:1 Ratio Nobody Tracks — Shadow AI cost ratios in enterprise.
- Decoded AI Tech: AI Layoffs Hit Wall Street During Record Revenue — Headcount reduction and competitive automation pressure.
- JPMorgan Chase & Co. 2024 Annual Report — Official technology investment and AI strategy disclosures filed with the SEC.