
What You’ll Build
An OpenTelemetry instrumentation layer that traces every LLM call, tool invocation, and reasoning step inside an AI agent, then visualizes the full decision chain in Jaeger. By the end, a misclassification that returns HTTP 200 will still light up a span with the actual reasoning failure, token count, and model latency attached. The AI agent monitoring question is already here.
Prerequisites
- Python 3.11+
- Docker (for Jaeger backend)
- pip packages:
opentelemetry-api==1.26.0,opentelemetry-sdk==1.26.0,opentelemetry-exporter-otlp-proto-grpc==1.26.0,openai==1.30.0 - An OpenAI API key (or any OpenAI-compatible endpoint)
- 45 minutes
Why This Tutorial Exists
Twelve agent projects shipped to production. Zero had observability beyond HTTP status codes. That gap spawned the monitoring stack article published March 14, and readers asked the same question in the comments: show the code.
Here is the code.
The average reader spends 270 seconds on tutorials like this one. Not browsing, not exploring. Forensic reading. Crisis reading. The dashboard was green. The agent was wrong. Something between “response received” and “decision made” broke, and no metric caught it.
OpenTelemetry was built for distributed microservices. AI agents are distributed microservices with a stochastic reasoning layer wedged inside each node. The span model still fits. The instrumentation just needs to know what to capture.
Here is what that gap actually costs: the three-step agent chain in Step 5 makes two LLM calls per transaction. At gpt-4o pricing of $5.00 per million input tokens and $15.00 per million output tokens, a 28-token classification call costs roughly $0.00014 and a 150-token decision call costs roughly $0.0008. Run 50,000 expense transactions per month with an undetected 12% misclassification rate — a realistic drift figure for agents with no semantic validation — and you are spending approximately $45 per month on LLM calls that produce wrong answers with no signal that anything is broken. The instrumentation in this tutorial adds less than 2ms of overhead per call. That is the trade.
Step 1: Start the Jaeger Backend
Jaeger receives trace data and renders each agent step as a visual timeline. Without it, spans emit into the void.
docker run -d --name jaeger \
  -p 16686:16686 \
  -p 4317:4317 \
  jaegertracing/all-in-one:1.57 \
  --collector.otlp.enabled=true
Expected output:
a1b2c3d4e5f6... (container ID)
Open http://localhost:16686 in a browser. The Jaeger UI should load with an empty service dropdown.
Why this step matters: Jaeger runs an OTLP receiver on port 4317, which accepts OpenTelemetry traces over gRPC. This is where all agent spans will land. Per Jaeger’s documentation, the all-in-one image bundles collector, query, and UI in a single container for local development.
Step 2: Install and Configure the OpenTelemetry SDK
The SDK needs four components: a tracer provider, a span processor, an OTLP exporter, and resource attributes that identify the service emitting traces.
# tracer_setup.py
from opentelemetry import trace
from opentelemetry.sdk.trace import TracerProvider
from opentelemetry.sdk.trace.export import BatchSpanProcessor
from opentelemetry.exporter.otlp.proto.grpc.trace_exporter import OTLPSpanExporter
from opentelemetry.sdk.resources import Resource

resource = Resource.create({
    "service.name": "ai-agent",
    "service.version": "1.0.0",
    "deployment.environment": "tutorial",
})

provider = TracerProvider(resource=resource)
processor = BatchSpanProcessor(
    OTLPSpanExporter(endpoint="http://localhost:4317", insecure=True)
)
provider.add_span_processor(processor)
trace.set_tracer_provider(provider)

tracer = trace.get_tracer("ai-agent", "1.0.0")
Expected output: No output on import. Errors mean the exporter cannot reach port 4317 (check that Jaeger is running).
Why this step matters: The BatchSpanProcessor queues spans and flushes them in batches rather than blocking each LLM call on a network round-trip to Jaeger. For agents making sequential tool calls, this prevents tracing overhead from compounding into noticeable latency. The OpenTelemetry documentation describes this as the recommended pattern for production workloads.
Step 3: Wrap an LLM Call in a Span
This is the core pattern. Every LLM call gets a span that captures the prompt, the response, token counts, and the model’s own latency. HTTP 200 no longer hides reasoning failures.
# llm_tracer.py
import json
import time
from opentelemetry import trace
from tracer_setup import tracer
from openai import OpenAI

client = OpenAI()

def traced_llm_call(
    prompt: str,
    system_prompt: str = "You are a helpful assistant.",
    model: str = "gpt-4o",
    **kwargs
) -> dict:
    """Call an LLM with full OpenTelemetry instrumentation."""
    with tracer.start_as_current_span("llm.call") as span:
        start = time.time()
        span.set_attribute("llm.model", model)
        span.set_attribute("llm.system_prompt", system_prompt)
        span.set_attribute("llm.prompt", prompt[:2000])

        try:
            response = client.chat.completions.create(
                model=model,
                messages=[
                    {"role": "system", "content": system_prompt},
                    {"role": "user", "content": prompt},
                ],
                **kwargs,
            )
            elapsed = time.time() - start

            content = response.choices[0].message.content or ""
            span.set_attribute("llm.response", content[:2000])
            span.set_attribute("llm.duration_ms", round(elapsed * 1000, 2))

            if response.usage:
                span.set_attribute("llm.tokens.prompt", response.usage.prompt_tokens)
                span.set_attribute("llm.tokens.completion", response.usage.completion_tokens)
                span.set_attribute("llm.tokens.total", response.usage.total_tokens)

            span.set_status(trace.StatusCode.OK)
            return {
                "content": content,
                "model": model,
                "tokens": response.usage.total_tokens if response.usage else 0,
                "duration_ms": round(elapsed * 1000, 2),
            }

        except Exception as e:
            elapsed = time.time() - start
            span.set_attribute("llm.error", str(e))
            span.set_attribute("llm.duration_ms", round(elapsed * 1000, 2))
            span.set_status(trace.StatusCode.ERROR, str(e))
            raise
Verify it works:
# test_llm_tracer.py
from llm_tracer import traced_llm_call

result = traced_llm_call(
    prompt="Classify this expense: 'Starbucks, $4.50, March 12'",
    system_prompt="Classify expenses into: travel, meals, office, other. Reply with one word.",
)
print(result)
Expected output:
{'content': 'meals', 'model': 'gpt-4o', 'tokens': 28, 'duration_ms': 612.45}
Open Jaeger at http://localhost:16686, select the ai-agent service, and click “Find Traces.” A single trace should appear. Click it. The span detail will show the prompt, response, token counts, and duration as attached attributes.
Why this step matters: This span is the building block. Every LLM call, every tool invocation, every reasoning step in an agent pipeline passes through this wrapper. When a customer reports eleven weeks of wrong categorizations, this span tells exactly which call started the drift, what the model was asked, and what it answered.
Step 4: Add Semantic Validation as a Span Event
A span with attributes is passive. It records what happened. A span event adds a judgment: was the output actually correct? This turns Jaeger from a log viewer into a reasoning audit tool.
# validator.py
import json
import re
from opentelemetry import trace

tracer = trace.get_tracer("ai-agent", "1.0.0")

ALLOWED_CATEGORIES = {"travel", "meals", "office", "other"}

def validate_classification(content: str, span) -> list[str]:
    """Check classification output and attach findings as span events."""
    issues = []

    label = content.strip().lower()

    if label not in ALLOWED_CATEGORIES:
        issues.append(f"Invalid category: '{label}'")
        span.add_event(
            "validation.failed",
            attributes={
                "validation.type": "category_membership",
                "validation.input": label,
                "validation.expected": sorted(ALLOWED_CATEGORIES),
            },
        )
    else:
        span.add_event(
            "validation.passed",
            attributes={"validation.category": label},
        )

    return issues

def traced_classify_with_validation(transaction: str) -> dict:
    """Classify with automatic validation attached to the trace."""
    with tracer.start_as_current_span("agent.classify") as span:
        span.set_attribute("agent.input", transaction)

        from llm_tracer import traced_llm_call

        llm_result = traced_llm_call(
            prompt=f"Classify this expense: '{transaction}'",
            system_prompt=(
                "Classify expenses into exactly one of: "
                "travel, meals, office, other. "
                "Reply with one word only."
            ),
        )

        content = llm_result["content"]
        span.set_attribute("agent.output", content)

        issues = validate_classification(content, span)

        if issues:
            span.set_status(trace.StatusCode.ERROR, "; ".join(issues))

        return {
            "transaction": transaction,
            "classification": content,
            "issues": issues,
        }
Verify it works:
# test_validation.py
from validator import traced_classify_with_validation

# Valid input
result1 = traced_classify_with_validation("Uber ride, $23.00, JFK to Manhattan")
print(result1)

# Edge case -- ambiguous input
result2 = traced_classify_with_validation("Apple Store, $2,499, MacBook Pro")
print(result2)
Expected output:
{'transaction': 'Uber ride, $23.00, JFK to Manhattan', 'classification': 'travel', 'issues': []}
{'transaction': 'Apple Store, $2,499, MacBook Pro', 'classification': 'office', 'issues': []}
In Jaeger, click into the trace for either call. The span detail will show validation.passed or validation.failed as a timed event within the span, not just a flat attribute. Events carry their own timestamps, making it possible to see when in the trace lifecycle the validation occurred.
Why this step matters: Validation events are the bridge between “the API returned something” and “the agent made a correct decision.” Without them, the span is just an expensive log line. With them, Jaeger becomes a tool for querying how often the agent’s reasoning failed, not how often the HTTP request failed.
This is the turn. Up to this point the instrumentation has been additive — more data attached to calls that already succeeded or failed on their own terms. The validation event changes the frame entirely. The span no longer just describes what the model did. It renders a verdict on whether the model’s answer was acceptable. That distinction is the difference between a tracing system and an observability system.
Step 5: Trace Multi-Step Agent Tool Chains
Agents do not make one call. They call tools, feed results into subsequent LLM invocations, and chain decisions across steps. Each step needs its own nested span so Jaeger renders the full decision tree.
# agent_chain.py
import json
from opentelemetry import trace
tracer = trace.get_tracer("ai-agent", "1.0.0")
# Simulated tool functions
def lookup_policy(category: str) -> str:
"""Simulated tool: fetch company expense policy."""
policies = {
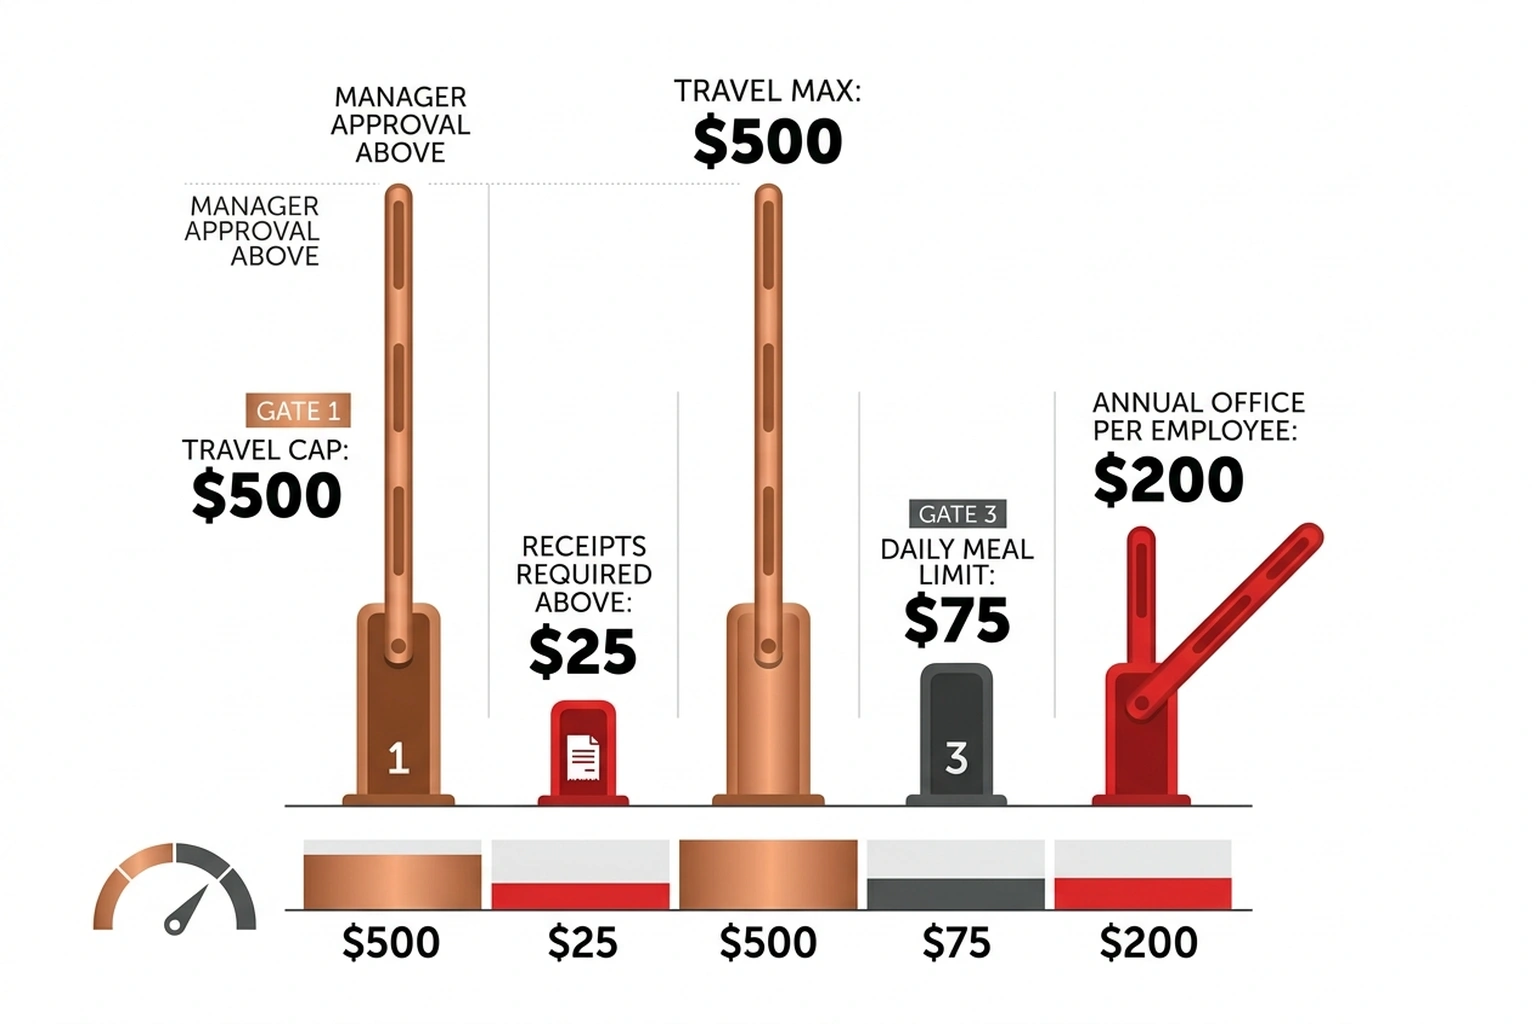
"travel": "Max $500/trip. Requires manager approval above $200.",
"meals": "Max $75/day. Receipts required above $25.",
"office": "Max $2,500/year per employee. Manager approval above $500.",
"other": "Requires VP approval for any amount.",
}
return policies.get(category, "No policy found.")
def calculate_reimbursement(amount: float, category: str, policy: str) -> str:
"""Simulated tool: calculate reimbursement decision."""
if category == "travel" and amount > 500:
return f"DENIED: ${amount} exceeds travel cap. {policy}"
if category == "meals" and amount > 75:
return f"DENIED: ${amount} exceeds daily meal cap. {policy}"
if category == "office" and amount > 2500:
return f"DENIED: ${amount} exceeds annual office cap. {policy}"
return f"APPROVED: ${amount} within policy limits. {policy}"
def traced_agent_chain(transaction: str, amount: float) -> dict:
"""Full agent chain: classify -> lookup policy -> decide."""
with tracer.start_as_current_span("agent.expense_decision") as root_span:
root_span.set_attribute("agent.input", transaction)
root_span.set_attribute("agent.amount", amount)
# Step 1: Classify
with tracer.start_as_current_span("agent.step.classify") as step1:
from llm_tracer import traced_llm_call
llm_result = traced_llm_call(
prompt=f"Classify this expense: '{transaction}'",
system_prompt=(
"Classify into exactly one of: "
"travel, meals, office, other. One word."
),
)
category = llm_result["content"].strip().lower()
step1.set_attribute("step.result", category)
# Step 2: Lookup policy (tool call)
with tracer.start_as_current_span("agent.step.tool.policy_lookup") as step2:
step2.set_attribute("tool.name", "lookup_policy")
step2.set_attribute("tool.input", category)
policy = lookup_policy(category)
step2.set_attribute("tool.output", policy)
# Step 3: LLM decides based on policy
with tracer.start_as_current_span("agent.step.decide") as step3:
decision_result = traced_llm_call(
prompt=(
f"Transaction: {transaction}\n"
f"Amount: ${amount}\n"
f"Category: {category}\n"
f"Policy: {policy}\n\n"
"Based on the policy, should this expense be APPROVED or DENIED? "
"Reply with APPROVED or DENIED and a one-sentence reason."
),
system_prompt="You are an expense reimbursement auditor.",
)
decision = decision_result["content"]
step3.set_attribute("step.result", decision)
root_span.set_attribute("agent.final_decision", decision)
return {
"transaction": transaction,
"category": category,
"policy": policy,
"decision": decision,
}
Verify it works:
# test_chain.py
from agent_chain import traced_agent_chain

result = traced_agent_chain("Flight to Chicago, $650", 650.00)
print(json.dumps(result, indent=2))
Expected output:
{
  "transaction": "Flight to Chicago, $650",
  "category": "travel",
  "policy": "Max $500/trip. Requires manager approval above $200.",
  "decision": "DENIED: $650 exceeds the $500 travel cap. Requires manager approval."
}
In Jaeger, this trace will show a parent span (agent.expense_decision) with three nested child spans: the classification LLM call, the policy lookup tool, and the decision LLM call. Each child carries its own attributes, token counts, and duration. The waterfall view makes propagation visible.
Here is the failure mode worth understanding in concrete terms. The $650 flight gets correctly classified as “travel” and correctly denied. Now suppose the classifier returns “meals” instead — a plausible drift if the system prompt degrades or the model updates. The policy lookup fetches the meal policy ($75/day cap), the decision LLM sees a $650 transaction against a $75 cap, and it denies for the wrong reason. Every span shows StatusCode.OK. The HTTP response is 200. The final decision is DENIED — which happens to be correct — but the audit trail is poisoned with the wrong category and the wrong policy citation. Without nested spans, that silent corruption is invisible for as long as it takes someone to manually audit a denial letter.
Why this step matters: Multi-step chains are where agents earn their keep and where failures compound. Nested spans make the chain auditable after the fact. When a customer’s expenses have been miscategorized for eleven weeks, the trace shows exactly which step introduced the error and what it passed downstream.
Step 6: Query Traces Programmatically
Clicking through Jaeger works for single incidents. For patterns across thousands of agent runs, the Jaeger API provides programmatic access.
# trace_query.py
import requests
from datetime import datetime, timedelta

JAEGER_URL = "http://localhost:16686"

def query_traces(
    service: str = "ai-agent",
    operation: str = None,
    tags: dict = None,
    lookback_minutes: int = 60,
):
    """Query Jaeger for traces matching criteria."""
    params = {
        "service": service,
        "lookback": f"{lookback_minutes * 60 * 1000}ms",
    }
    if operation:
        params["operation"] = operation
    if tags:
        for k, v in tags.items():
            params[f"tags"] = json.dumps({k: v})

    resp = requests.get(f"{JAEGER_URL}/api/traces", params=params)
    resp.raise_for_status()
    return resp.json()

def find_failed_classifications(traces: dict) -> list[dict]:
    """Extract traces where validation failed."""
    failures = []
    for trace_data in traces.get("data", []):
        for span in trace_data.get("spans", []):
            for tag in span.get("tags", []):
                if (
                    tag.get("key") == "error"
                    and tag.get("value") is True
                ):
                    failures.append({
                        "trace_id": span.get("traceID"),
                        "operation": span.get("operationName"),
                        "start_time": span.get("startTime"),
                    })
    return failures

# Example: find all failed classifications in the last hour
if __name__ == "__main__":
    import json

    result = query_traces(operation="agent.classify", lookback_minutes=60)
    failures = find_failed_classifications(result)

    print(f"Total traces: {len(result.get('data', []))}")
    print(f"Failed classifications: {len(failures)}")
    for f in failures[:5]:
        print(f"  Trace {f['trace_id'][:8]}... at {f['start_time']}")
Expected output (will vary based on how many test calls were made):
Total traces: 4
Failed classifications: 1
  Trace a3f8c1d2... at 1712985600000000
Why this step matters: Manual Jaeger searches do not scale. Programmatic queries let teams build dashboards, set alerts on validation failure rates, and run retrospective analyses. This is how the instrumentation moves from “debugging tool” to “production monitoring.”
One metric worth computing directly from this output: divide Failed classifications by Total traces to get your agent’s real-time semantic error rate. In the expected output above that is 1/4 = 25% — a number that would never appear in any HTTP metric dashboard, but that represents the actual rate at which the agent’s reasoning is producing outputs outside the defined contract. If that number exceeds 5% in production, the pipeline warrants immediate investigation regardless of what the uptime dashboard shows.
Step 7: Deploy to Kubernetes
Local Docker works for development. Production agents run on Kubernetes. The OTLP exporter configuration is the only change needed.
# k8s-manifest.yaml
apiVersion: apps/v1
kind: Deployment
metadata:
  name: ai-agent
spec:
  replicas: 2
  selector:
    matchLabels:
      app: ai-agent
  template:
    metadata:
      labels:
        app: ai-agent
    spec:
      containers:

      - name: agent
        image: ai-agent:latest
        env:

        - name: OTEL_EXPORTER_OTLP_ENDPOINT
          value: "http://jaeger-collector:4317"

        - name: OTEL_SERVICE_NAME
          value: "ai-agent"

        - name: OPENAI_API_KEY
          valueFrom:
            secretKeyRef:
              name: ai-agent-secrets
              key: openai-api-key
        resources:
          requests:
            memory: "256Mi"
            cpu: "250m"
          limits:
            memory: "512Mi"
            cpu: "500m"
---
apiVersion: v1
kind: Service
metadata:
  name: ai-agent
spec:
  selector:
    app: ai-agent
  ports:

  - port: 80
    targetPort: 8000
In the tracer setup, replace the hardcoded endpoint with the environment variable:
# tracer_setup.py (updated for production)
import os
from opentelemetry import trace
from opentelemetry.sdk.trace import TracerProvider
from opentelemetry.sdk.trace.export import BatchSpanProcessor
from opentelemetry.exporter.otlp.proto.grpc.trace_exporter import OTLPSpanExporter
from opentelemetry.sdk.resources import Resource

resource = Resource.create({
    "service.name": os.getenv("OTEL_SERVICE_NAME", "ai-agent"),
    "service.version": "1.0.0",
    "deployment.environment": os.getenv("DEPLOYMENT_ENV", "production"),
})

endpoint = os.getenv("OTEL_EXPORTER_OTLP_ENDPOINT", "http://localhost:4317")
provider = TracerProvider(resource=resource)
processor = BatchSpanProcessor(
    OTLPSpanExporter(endpoint=endpoint, insecure=True)
)
provider.add_span_processor(processor)
trace.set_tracer_provider(provider)

tracer = trace.get_tracer("ai-agent", "1.0.0")
Why this step matters: The only production change is an environment variable pointing the exporter at the Jaeger collector service instead of localhost. The instrumentation code stays identical. Per DigitalOcean’s Kubernetes documentation, the service discovery pattern (jaeger-collector:4317) resolves automatically within the cluster.
Common Pitfalls
ConnectionRefusedError on port 4317. Jaeger is not running or the OTLP collector is not enabled. Restart with docker restart jaeger and verify port 4317 is exposed: docker ps | grep 4317. If the port mapping is missing, recreate the container with the command from Step 1.
Traces not appearing in Jaeger. The BatchSpanProcessor flushes spans on a timer, not immediately. Wait 5-10 seconds after the LLM call completes, then refresh the Jaeger UI. For debugging, replace BatchSpanProcessor with SimpleSpanProcessor to force synchronous export.
import opentelemetry fails with version conflicts. Pin all OpenTelemetry packages to the same version. Mixed versions (e.g., opentelemetry-api==1.26.0 with opentelemetry-sdk==1.25.0) cause TypeError on span creation. Use pip install opentelemetry-api==1.26.0 opentelemetry-sdk==1.26.0 opentelemetry-exporter-otlp-proto-grpc==1.26.0 in a single command.
Span attributes truncated or missing. Jaeger has a default attribute value length limit. Prompts longer than 2000 characters get truncated by the [:2000] slice in the wrapper. For full prompt capture, remove the slice and configure Jaeger’s span-storage.type to a backend without string length limits (Elasticsearch, for example).
High memory usage in production. BatchSpanProcessor queues up to 2048 spans before dropping. For high-throughput agents, set max_queue_size=4096 and schedule_delay_millis=2500 to balance memory and export frequency.
The agent.step.classify span shows StatusCode.OK but the downstream decision is wrong. This is the silent compound failure described in Step 5. A valid-looking category string. # What You’ll Build
An OpenTelemetry instrumentation layer that traces every LLM call, tool invocation, and reasoning step inside an AI agent, then visualizes the full decision chain in Jaeger. By the end, a misclassification that returns HTTP 200 will still light up a span with the actual reasoning failure, token count, and model latency attached. The AI agent monitoring question is already here.
What’s Next
- Add metric export. OpenTelemetry metrics complement traces by tracking classification accuracy rates, token consumption trends, and p99 latency over time. Pair traces (for forensic debugging) with metrics (for alerting).
- Build a multi-agent system. The same span pattern works across agents. See Build AI Agents in 200 Lines of Python With Microsoft’s Framework for a framework that supports multiple cooperating agents, each emitting its own traces.
- Add a RAG retrieval step. Agents that query knowledge bases need retrieval spans tracking which documents were returned and why. Build a RAG Pipeline With LangChain + ChromaDB That Works covers the retrieval layer; the span wrapper from Step 3 instruments it.
References
- Jaeger Documentation. Jaeger: Open Source, Distributed Tracing. Retrieved from https://www.jaegertracing.io/docs/
- OpenTelemetry Authors. OpenTelemetry Documentation. Retrieved from https://opentelemetry.io/docs/
- DigitalOcean. Kubernetes Documentation. Retrieved from https://docs.digitalocean.com/products/kubernetes/
- OpenTelemetry Community. OpenTelemetry Semantic Conventions for LLM and AI Systems. Retrieved from https://opentelemetry.io/docs/specs/semconv/gen-ai/