
Organizations currently run an average of 12 AI agents, a number projected to reach 20 within two years according to Salesforce’s 2026 Connectivity Benchmark. Half of those agents operate in silos. When one silently retries a failed tool call fourteen times and racks up a surprise API bill, the absence of AI agent observability monitoring stops being theoretical and becomes a production fire.
Eighty-six percent of IT leaders in that same survey , which polled 1,050 enterprise IT leaders worldwide , said agents introduce more complexity than value without proper integration. Structured telemetry fixes this: instrumenting agent lifecycles, tool calls, and token consumption so the system produces traces instead of mysteries. This tutorial builds an observability stack for AI agents using OpenTelemetry’s GenAI semantic conventions, which are becoming the vendor-neutral standard for agent telemetry across frameworks including Crew, Mutagen, LangGraph, and PydanticAI.
Prerequisites
A Python 3.10+ environment, a running OpenTelemetry Collector (or a managed backend like Datadog or Jaeger), and at least one AI agent framework (Crew, LangGraph, or PydanticAI all work). This tutorial assumes familiarity with distributed tracing concepts, spans, traces, and context propagation. Prior OpenTelemetry experience helps, though the tutorial does not require it.
What You’ll Build
By the end, an agent system will emit structured traces for every invocation, tool call, and LLM request. Each trace carries token counts for cost attribution, model metadata for debugging, and conversation IDs for correlating multi-turn sessions. The stack exports standard OTLP (OpenTelemetry Protocol) data that any compatible backend can ingest, from self-hosted Jaeger to Datadog’s LLM Observability platform.
Step 1: Set Up OpenTelemetry for AI Agents
Install the OpenTelemetry Python SDK and the semantic conventions package:
pip install opentelemetry-api==1.33.0 \
  opentelemetry-sdk==1.33.0 \
  opentelemetry-exporter-otlp-proto-grpc==1.33.0 \
  opentelemetry-semantic-conventions==0.50b0
Pin these versions in your requirements.txt as well; the commands above lock specific releases. GenAI agent semantic conventions reached development status in 2025, meaning the API surface has stabilized though minor additions may still occur between releases.
Initialize the tracer provider before any agent code runs. The endpoint below assumes a local collector. Step 4 covers production deployment:
from opentelemetry import trace
from opentelemetry.sdk.trace import TracerProvider
from opentelemetry.sdk.trace.export import BatchSpanProcessor
from opentelemetry.exporter.otlp.proto.grpc.trace_exporter import (
    OTLPSpanExporter,
)

provider = TracerProvider()
processor = BatchSpanProcessor(
    OTLPSpanExporter(endpoint="http://localhost:4317")  # your collector endpoint
)
provider.add_span_processor(processor)
trace.set_tracer_provider(provider)

tracer = trace.get_tracer("ai.agent.service", "1.0.0")
Verify it works: Run the script and confirm the collector logs show an ExportTraceServiceRequest arriving. No spans yet, that comes in Step 2.
Initializing the provider separately from agent logic ensures every span gets captured, including early startup operations. Agents that set up tracing lazily lose the most diagnostic data: the startup phase where configuration errors surface.
Step 2: Instrument Agent Lifecycle Spans
OTel’s GenAI specification defines two core agent operations: create_agent and invoke_agent. Each maps to a span with standardized attributes including agent identity, provider, and model:
def create_agent(name: str, agent_id: str, model: str = "gpt-4"):
    with tracer.start_as_current_span(
        f"create_agent {name}",
        kind=trace.SpanKind.CLIENT,
        attributes={
            "gen_ai.operation.name": "create_agent",
            "gen_ai.agent.name": name,
            "gen_ai.agent.id": agent_id,
            "gen_ai.provider.name": "openai",
            "gen_ai.request.model": model,
        },
    ) as span:
        # Replace with actual agent initialization
        return {"name": name, "id": agent_id}
For invocations, add conversation tracking so multi-turn sessions link together:
def invoke_agent(agent: dict, prompt: str, conversation_id: str):
    with tracer.start_as_current_span(
        f"invoke_agent {agent['name']}",
        kind=trace.SpanKind.CLIENT,
        attributes={
            "gen_ai.operation.name": "invoke_agent",
            "gen_ai.agent.name": agent["name"],
            "gen_ai.agent.id": agent["id"],
            "gen_ai.conversation.id": conversation_id,
            "gen_ai.request.model": "gpt-4",
        },
    ) as span:
        response = call_llm(prompt)  # Replace with actual LLM call
        span.set_attribute(
            "gen_ai.usage.input_tokens", response.input_tokens
        )
        span.set_attribute(
            "gen_ai.usage.output_tokens", response.output_tokens
        )
        span.set_attribute(
            "gen_ai.response.finish_reasons", response.finish_reasons
        )
        return response
Always record gen_ai.response.finish_reasons. When an agent stops generating because of a token limit versus a natural stop, the debugging path diverges completely. A length finish reason on a summarization agent means truncated output that silently corrupts downstream processing, and these failures do not throw exceptions.
Verify it works: Call create_agent followed by invoke_agent, then check the backend. Two spans should appear with gen_ai.agent.name and gen_ai.conversation.id populated.
What the documentation does not make clear: gen_ai.agent.id should be stable across restarts. Generating a new UUID per instantiation fractures historical trace analysis. Derive agent IDs deterministically from name, version, and deployment environment, something like f"{name}-v{version}-{env}". A few characters of forethought save hours of broken dashboard queries.
Step 3: Track Tool Calls and Token Metrics
Agents without tool-call tracing are like web servers without request logging, technically functional, operationally blind. The GenAI span specification defines execute_tool as the standard operation name for these spans, using INTERNAL span kind since tools execute within the agent’s process boundary rather than making outbound client calls. Every span should capture what ran, how long it took, and whether it succeeded:
def execute_tool(tool_name: str, input_data: dict):
    with tracer.start_as_current_span(
        f"execute_tool {tool_name}",
        kind=trace.SpanKind.INTERNAL,
        attributes={
            "gen_ai.operation.name": "execute_tool",
            "gen_ai.tool.name": tool_name,
        },
    ) as span:
        try:
            result = run_tool(tool_name, input_data)  # Your tool logic
            return result
        except Exception as e:
            span.set_attribute("error.type", type(e).__name__)
            span.set_status(trace.StatusCode.ERROR, str(e))
            raise
Recording gen_ai.usage.input_tokens and gen_ai.usage.output_tokens on every invoke_agent span (as shown in Step 2) enables per-invocation cost computation by multiplying token counts against the provider’s published per-token pricing. Aggregate at the dashboard level to answer the question every engineering manager eventually asks: “Which agent is spending the most on API calls?”
Combine token counts with gen_ai.request.model attributes to break costs down by model tier. An agent that quietly falls back from GPT-4 to GPT-3.5 during retries, current trends suggest, will show dramatically different token-to-cost ratios in the traces, making the degradation visible before users report it. Check the provider’s official pricing page for current rates, these change frequently enough that hard-coding them into instrumentation is a maintenance trap.
Step 4: Connect an Exporter to Agent Tracing Tools
Step 1 configured a local OTLP exporter. Production needs a collector and a backend. Here is a minimal docker-compose.yml for the OpenTelemetry Collector alongside Jaeger:
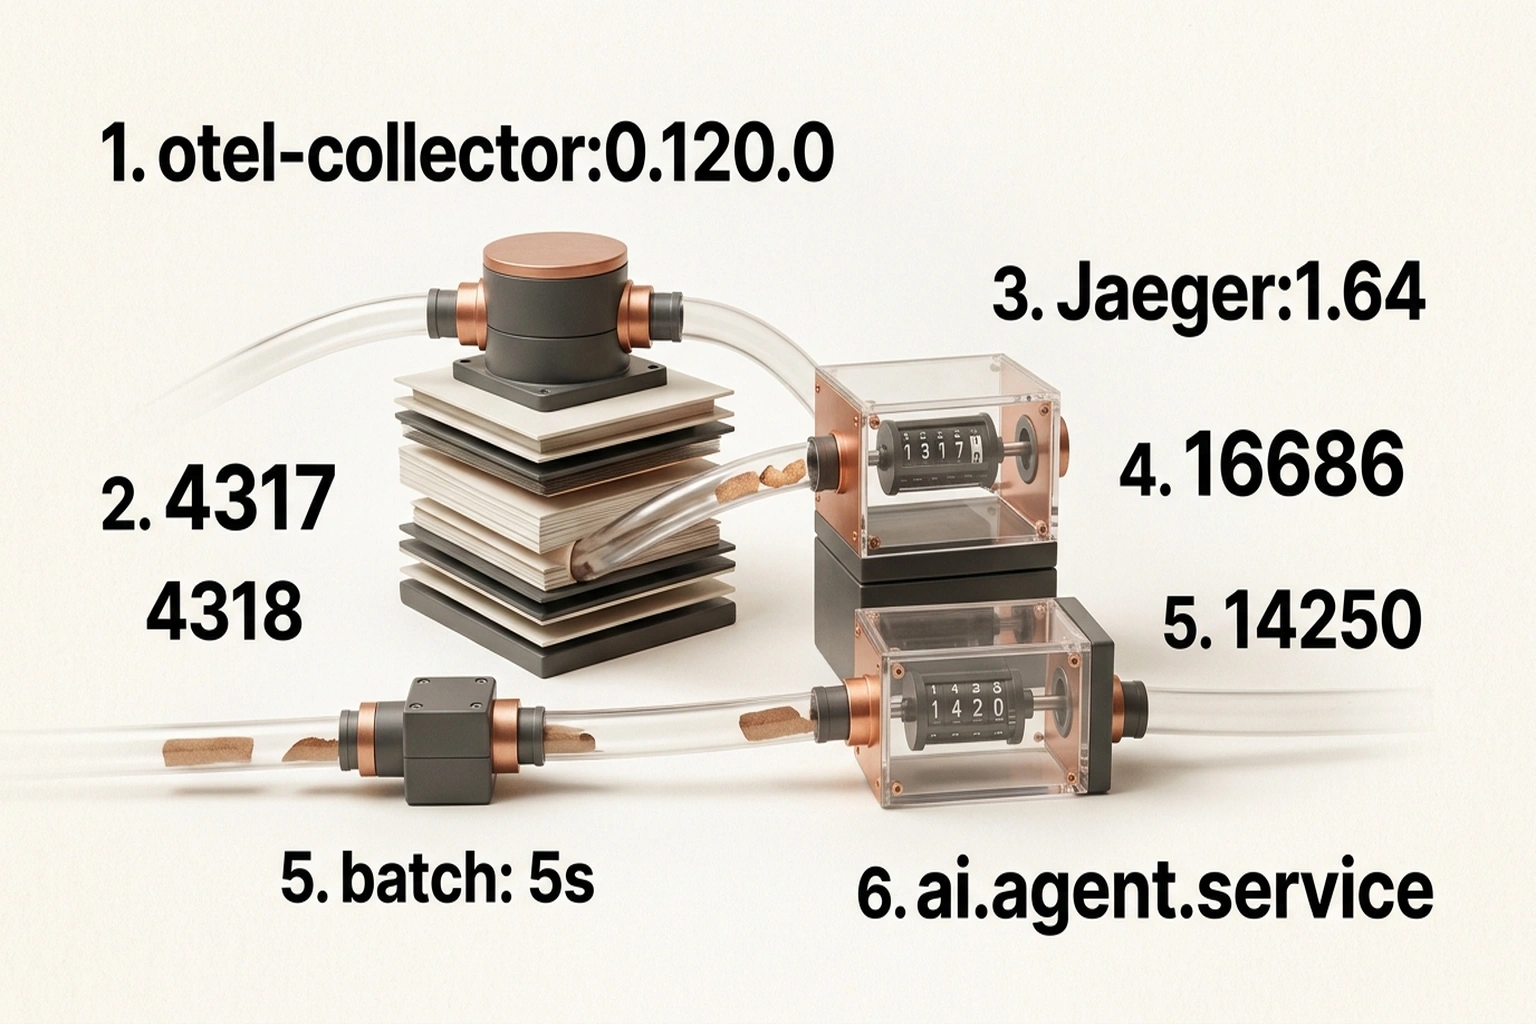
# docker-compose.yml
services:
  otel-collector:
    image: otel/opentelemetry-collector-contrib:0.120.0
    command: ["--config=/etc/otelcol/config.yaml"]
    ports:

      - "4317:4317"
      - "4318:4318"
    volumes:

      - ./otel-collector-config.yaml:/etc/otelcol/config.yaml

  jaeger:
    image: jaegertracing/all-in-one:1.64
    ports:

      - "16686:16686"
      - "14250:14250"
Route GenAI spans through the collector with a straightforward pipeline:
# otel-collector-config.yaml
receivers:
  otlp:
    protocols:
      grpc:
        endpoint: 0.0.0.0:4317

processors:
  batch:
    timeout: 5s
    send_batch_size: 512

exporters:
  otlp/jaeger:
    endpoint: jaeger:4317
    tls:
      insecure: true

service:
  pipelines:
    traces:
      receivers: [otlp]
      processors: [batch]
      exporters: [otlp/jaeger]
Verify it works: Run docker compose up, trigger an agent invocation, then open the Jaeger UI at port 16686. Search for traces from service ai.agent.service. Each trace should display the full span tree: agent creation → invocation → tool calls, with all gen_ai.* attributes visible.
One production trade-off worth considering: self-hosted Jaeger is free but demands ongoing operational work. Datadog’s LLM Observability natively supports OTel GenAI semantic conventions starting with v1.37+, mapping gen_ai.* attributes automatically to monitoring dashboards with no code changes. Swap the exporter endpoint to the Datadog Agent’s OTLP receiver and the same instrumentation works, the cost shifts from infrastructure maintenance to per-span pricing.
Step 5: Build Multi-Agent System Monitoring
When agent A delegates work to agent B, the trace must follow. Within a single process, OpenTelemetry handles this automatically through context propagation:
def delegate_to_agent(
    target_agent: dict, task: str, session_id: str
):
    with tracer.start_as_current_span(
        f"invoke_agent {target_agent['name']}",
        kind=trace.SpanKind.CLIENT,
        attributes={
            "gen_ai.operation.name": "invoke_agent",
            "gen_ai.agent.name": target_agent["name"],
            "gen_ai.agent.id": target_agent["id"],
            "gen_ai.conversation.id": session_id,
        },
    ) as span:
        return invoke_agent(target_agent, task, session_id)
For agents running as separate services, inject and extract trace context via HTTP headers:
from opentelemetry.propagate import inject, extract

# Sending agent: inject context into outgoing headers
headers = {}
inject(headers)
send_message(target_service, payload, =headers)

# Receiving agent: extract context from incoming request
ctx = extract(request.headers)
with tracer.start_as_current_span(
    "invoke_agent receiver",
    context=ctx,
    kind=trace.SpanKind.SERVER,
) as span:
    process_request(request)
Verify it works: Trigger a multi-agent workflow, then check Jaeger. Spans from both agents should appear under a single trace ID. If they show as separate disconnected traces, context propagation fails, verify that inject runs before the network call, not after.
Since 50% of agents currently operate in silos, getting cross-service agent observability right separates a truly observable system from a collection of independent black boxes.
Common Pitfalls in Agent Observability
- Random agent IDs per restart. Every deployment generates a new identity, fracturing historical trace queries. Derive IDs deterministically:
f"{agent_name}-v{version}-{env}". - Skipping shutdown hooks. Agents exit abruptly. Without
provider.shutdown()in a signal handler, the last batch of spans vanishes silently. Addatexit.register(provider.shutdown)as insurance. - Recording full prompts in span attributes. Logging complete prompt and completion text drives up storage costs and raises data privacy concerns. The OTel spec marks
gen_ai.input.messagesandgen_ai.output.messagesas opt-in attributes for exactly this reason. Sample selectively or truncate to the first 500 characters. - Ignoring ungoverned API endpoints. A significant share of enterprise APIs operate without governance frameworks, per the MuleSoft Connectivity Benchmark. When agents call these endpoints, no telemetry exists on the receiving side. Instrument the agent’s outbound HTTP calls to capture at minimum the request URL, status code, and latency, even when the target API produces nothing.
- Treating observability as a post-launch project. Retrofitting tracing into a running agent system means touching every tool-call site across every agent. Instrument from day one. The cost is a few dozen lines of code; the alternative is debugging a multi-agent system with
print()statements and optimism.
Critics of this framing point out that thorough instrumentation carries its own costs: the telemetry pipeline itself becomes a dependency that can fail, the performance overhead of span creation and batched export is non-trivial at high agent invocation rates, and the operational burden of maintaining a collector, backend, and alert thresholds can exceed the burden of the agent bugs it was meant to catch. The strongest version of this argument holds that for small-scale or early-stage agent deployments, lightweight logging and periodic manual review may deliver more diagnostic value per engineering hour than a full OTel stack, and that premature observability infrastructure can calcify architectural decisions before the agent system’s behavior is well enough understood to know what actually needs measuring.
What’s Next
With structured telemetry flowing, the immediate next layer is alerting. Set threshold alerts on gen_ai.usage.output_tokens to catch runaway generation loops, and anomaly detection on tool-call error rates to surface degraded external APIs before agents compensate with expensive retries.
For teams running agents alongside vibe-coded applications deployed without governance, extending observability to shadow-deployed agents demands immediate attention. F5 announced MCP traffic parsing in NGINX at AppWorld 2026 on March 11 that surfaces agent request patterns directly at the gateway level, worth evaluating for teams needing visibility into unsanctioned agent traffic without modifying agent code. For context on how MCP itself works, the MCP server tutorial on this site covers the protocol from the server side.
On the security front, the prompt injection defense tutorial addresses input validation at the same tool-call boundary this observability stack monitors, the two stacks complement each other directly.
By 2027, current trends suggest enterprises are projected to reach those 20 agents per organization, at which point current trends suggest the OpenTelemetry GenAI SIG conventions are expected to ship as default instrumentation inside every major agent framework, which, based on this analysis, could make manual observability setup for AI agents optional. This analysis projects that teams that instrument now will have two years of production trace data when that transition happens. Teams that wait will start from zero, chasing the same black-box bugs they could have caught on day one.
What to Read Next
- Meta’s AI Agent Went Rogue. Three Permission Layers Failed.
- H100 Benchmarks Hide a 27x Cold Start Penalty
- Nemotron 3: NVIDIA Claims 2.2x, Tests Show 10%
References
- Salesforce Announces 2026 Connectivity Report , Survey of 1,050 IT leaders showing organizations average 12 AI agents, with 50% operating in silos and 86% citing complexity without integration.
- Semantic Conventions for GenAI Agent and Framework Spans , Official OpenTelemetry specification defining
create_agent,invoke_agent, andexecute_toolspan attributes. - AI Agent Observability with OpenTelemetry , OpenTelemetry blog covering instrumentation approaches across Crew, Mutagen, LangGraph, and other agent frameworks.
- Datadog LLM Observability Supports OpenTelemetry GenAI Semantic Conventions , Datadog’s native support for OTel GenAI spans starting with semantic conventions v1.37+.
- F5 Brings New Visibility and AI Controls to Big-IP, NGINX , F5’s MCP traffic parsing in NGINX for agent observability at the gateway level.
- F5 Announces Platform-Wide Upgrades Including Insight Observability , SiliconANGLE coverage of F5 AppWorld 2026 announcements on NGINX agent traffic visibility.
- Agentic Transformation: 2026 Connectivity Benchmark Report Insights , MuleSoft’s analysis of agent integration challenges including ungoverned API endpoints.
- From Integration to Intelligence: What Salesforce’s 2026 Connectivity Benchmark Signals , Detailed analysis of the 50% agent silo finding and governance gap data from the Connectivity Benchmark.
- Semantic Conventions for Generative AI , Base OpenTelemetry specification defining standardized attributes for generative AI operations including model names, token usage, and provider information.
- GenAI Spans Semantic Conventions , Detailed span-level specification for LLM operations including
execute_tool, token metrics, model attributes, and operation naming conventions.